
U.S. Highway Truck Corridors Reveal the Backbone of America’s Supply Chain, Mapping Where the Nation’s Economy Truly Moves
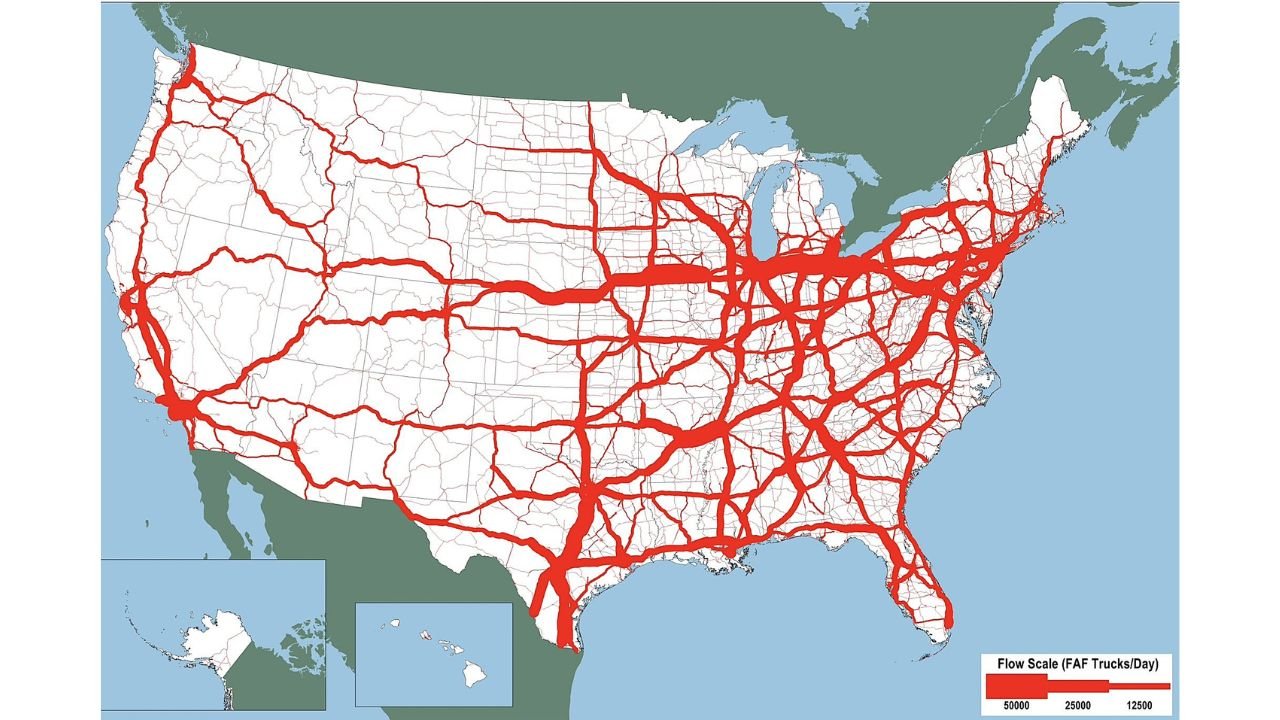
UNITED STATES — A nationwide map showing average daily long-haul truck traffic on U.S. highways reveals how deeply the American economy depends on a handful of critical freight corridors, with the heaviest truck volumes concentrated across the Midwest, Southeast, Texas, and the Northeast Megaregion.
The data, which tracks Federal Highway Administration freight flows, highlights the routes carrying tens of thousands of trucks per day, forming the logistical spine that keeps food, fuel, retail goods, manufacturing inputs, and medical supplies moving across the country.
Interstate Highways Carry the Heaviest Freight Burden
The map clearly shows that Interstate highways, not secondary roads, handle the overwhelming majority of long-haul truck traffic. Some of the most heavily used corridors include:
- I-40 and I-44, linking California ports to the Midwest and Southeast
- I-10, stretching from Southern California through Texas and the Gulf Coast
- I-35, a major north-south trade artery through Texas and the central U.S.
- I-70 and I-80, connecting the Plains and Rockies to eastern manufacturing hubs
- I-95, serving the dense population centers of the East Coast
These routes are not just highways — they are economic lifelines.
Why the Midwest and Southeast See Heavy Truck Density
The Midwest stands out as a freight crossroads due to its role in manufacturing, agriculture, and distribution. Major hubs around Chicago, St. Louis, Indianapolis, and Columbus funnel goods in every direction.
Meanwhile, the Southeast shows intense truck traffic tied to:
- Expanding population growth
- Port activity along the Gulf Coast and Atlantic
- Major distribution centers serving retailers and e-commerce
Texas, in particular, emerges as one of the most critical logistics states in the country, linking ports, energy infrastructure, and cross-border trade.
Ports and Population Centers Drive Truck Volume
Heavy truck corridors cluster around:
- West Coast ports handling international imports
- Great Lakes manufacturing regions
- East Coast urban corridors, where population density drives daily demand
Once cargo arrives at ports or rail terminals, trucks take over — delivering goods to warehouses, stores, hospitals, and factories.
Supply Chain Vulnerability Becomes Clear
This map also reveals a major risk: when these corridors fail, the economy feels it fast.
Ice storms, hurricanes, fuel shortages, labor disruptions, or infrastructure damage along any of these routes can quickly trigger:
- Store shortages
- Delayed medical shipments
- Manufacturing slowdowns
- Rising consumer prices
In recent years, extreme weather events and aging infrastructure have shown just how fragile these systems can be.
Aging Roads, Rising Demand
Many of the busiest freight highways were built decades ago and now carry far more traffic than they were designed for. With truck volumes continuing to grow, experts warn that without sustained investment, congestion and breakdown risks will worsen.
The map makes one thing clear: America’s supply chain doesn’t move evenly — it funnels through specific corridors, and those corridors matter more than ever.
Why This Matters to Everyday Americans
Every grocery run, prescription refill, construction project, and online order depends on these highways. While the map may look like lines on paper, it actually traces the daily movement of the U.S. economy.
When those red lines slow down, everyone feels it.
What do you think — is the U.S. investing enough in the highways that keep the country running, or are we pushing aging infrastructure past its breaking point? Share your thoughts and stay connected with Waldronnews.com for more national insight.