
Florida, Texas, Louisiana, Alabama and Gulf Coast States Face Hurricane Forecast Changes as NHC Unveils New Experimental “Cone of Uncertainty” for 2026 Season
UNITED STATES — With the 2026 Atlantic hurricane season approaching, the National Hurricane Center (NHC) is preparing to roll out a new experimental graphic designed to improve how storm forecast uncertainty is communicated to the public. The updated visualization, known as the “Experimental Ellipse Cone of Uncertainty,” aims to provide a clearer picture of where tropical storms and hurricanes could track as they move toward the United States.
The change comes as forecasters and emergency managers continue working to improve public understanding of hurricane forecast maps, which are critical tools used during tropical storm and hurricane threats along the Gulf Coast, Florida, and the Southeastern United States.
A New Look at Hurricane Forecast Uncertainty
For many years, hurricane forecasts have been shown using the familiar “cone of uncertainty,” a graphic that uses circular zones along a projected storm path to represent where the center of a tropical cyclone could travel over time.
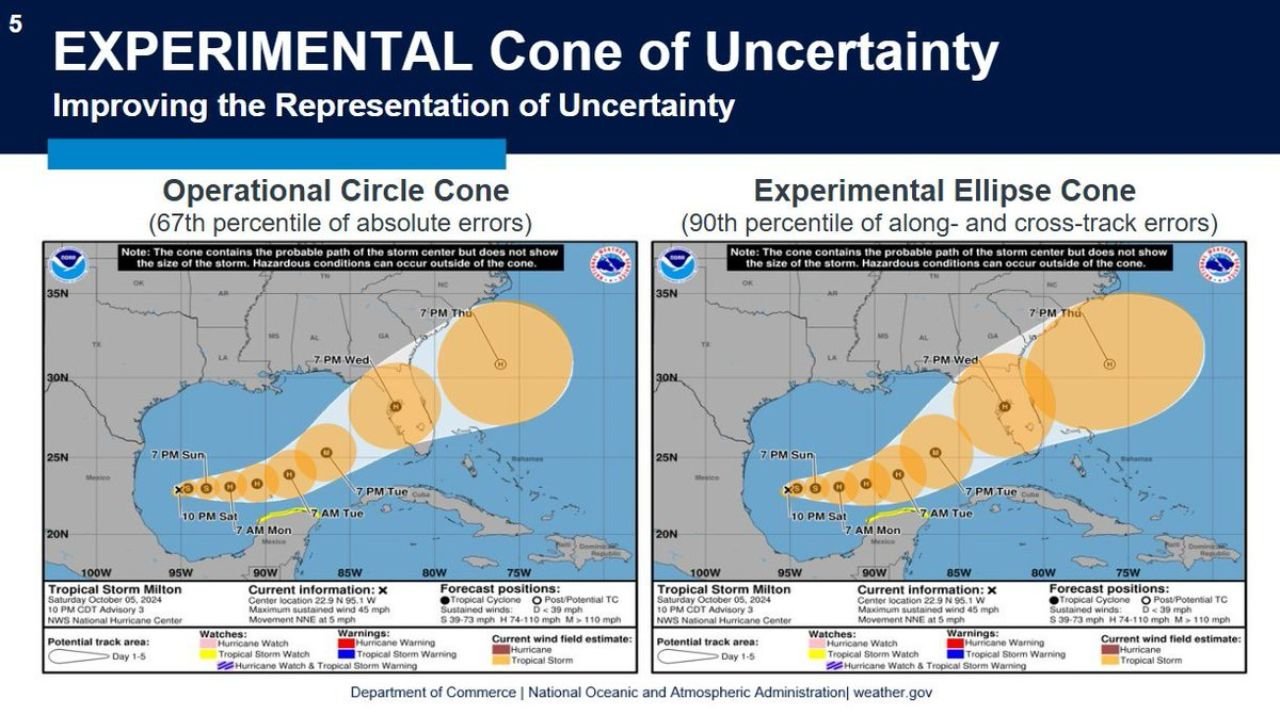
The current version, known as the Operational Circle Cone, is based on the 67th percentile of historical forecast errors. This means that historically, about two-thirds of storms have stayed within the cone’s boundaries.
However, the National Hurricane Center is now testing a new approach called the Experimental Ellipse Cone, which uses elliptical shapes instead of circles to better represent how forecast uncertainty expands as a storm travels farther into the future.
Why the Ellipse Cone Could Improve Forecast Clarity
The new ellipse design is based on the 90th percentile of along-track and cross-track forecast errors, allowing forecasters to better capture the realistic range of possible storm paths.
In simple terms, the experimental cone attempts to:
- Show a more realistic spread of potential storm tracks
- Highlight how uncertainty grows farther out in the forecast
- Provide clearer guidance for emergency planning
Because storms rarely move in perfectly circular patterns, the ellipse format better reflects how forecast uncertainty typically spreads along and across the predicted storm track.
Example Scenario Shows Storm Tracking Toward the U.S.
The demonstration graphic used by the National Hurricane Center shows a hypothetical tropical storm forming in the western Caribbean Sea, moving northward toward the Gulf of Mexico, and eventually approaching the U.S. Gulf Coast and Florida region.
As the forecast timeline progresses, the cone expands to show increasing uncertainty in the storm’s track. In both the traditional and experimental versions, the storm’s potential path stretches from the Yucatán Peninsula through the Gulf of Mexico toward the southeastern United States.
However, the ellipse version visually spreads the uncertainty differently, helping highlight that storms may shift both east or west of the central forecast track.
Why This Change Matters for Coastal Communities
Improving hurricane forecast graphics is especially important for communities across:
- Florida
- Texas
- Louisiana
- Mississippi
- Alabama
- Georgia
- The Carolinas
Residents in these areas often rely heavily on hurricane forecast maps to determine whether to prepare for evacuations or storm impacts.
One of the biggest misunderstandings about the traditional cone is that many people assume the storm’s impacts will stay within the cone boundaries. In reality, hazards such as wind, rain, and storm surge can occur well outside the cone, depending on the storm’s size and structure.
The updated graphic aims to reinforce that storms are complex systems with impacts that extend far beyond the forecast center track.
Hurricane Season Approaching in Just Weeks
The announcement comes as the Atlantic hurricane season continues to approach, which officially begins on June 1 and runs through November 30 each year.
Meteorologists are already monitoring early-season patterns that could influence storm activity across the Atlantic Ocean, Caribbean Sea, and Gulf of Mexico later this year.
Even before the first storm forms, agencies like the National Hurricane Center regularly refine their tools to ensure forecasts remain clear, accurate, and easy for the public to understand.
Experimental Graphic Will Be Closely Watched
The new ellipse cone will initially be used as an experimental product, allowing meteorologists and emergency managers to evaluate how effectively the graphic communicates forecast uncertainty.
If successful, the updated visualization could eventually become part of the standard hurricane forecast graphics used during tropical storm threats affecting the United States.
As the 2026 hurricane season draws closer, forecasters emphasize that understanding hurricane forecasts—and the uncertainty within them—remains one of the most important factors in helping communities prepare for dangerous storms.
Stay with WaldronNews for continuing updates on hurricane season forecasts and major weather developments across the United States.