
Illinois, Indiana and Missouri Tornado Zone Shows Stronger-Than-Expected Verification, Raising Questions About How 10% Risk Areas Perform
MIDWEST UNITED STATES — A new tornado verification analysis from the February 19, 2026 event is drawing attention across the weather community, showing that the core impact zone over Illinois, Indiana, and eastern Missouri verified at higher probabilities than many people assume when they see a “10%” outlook.
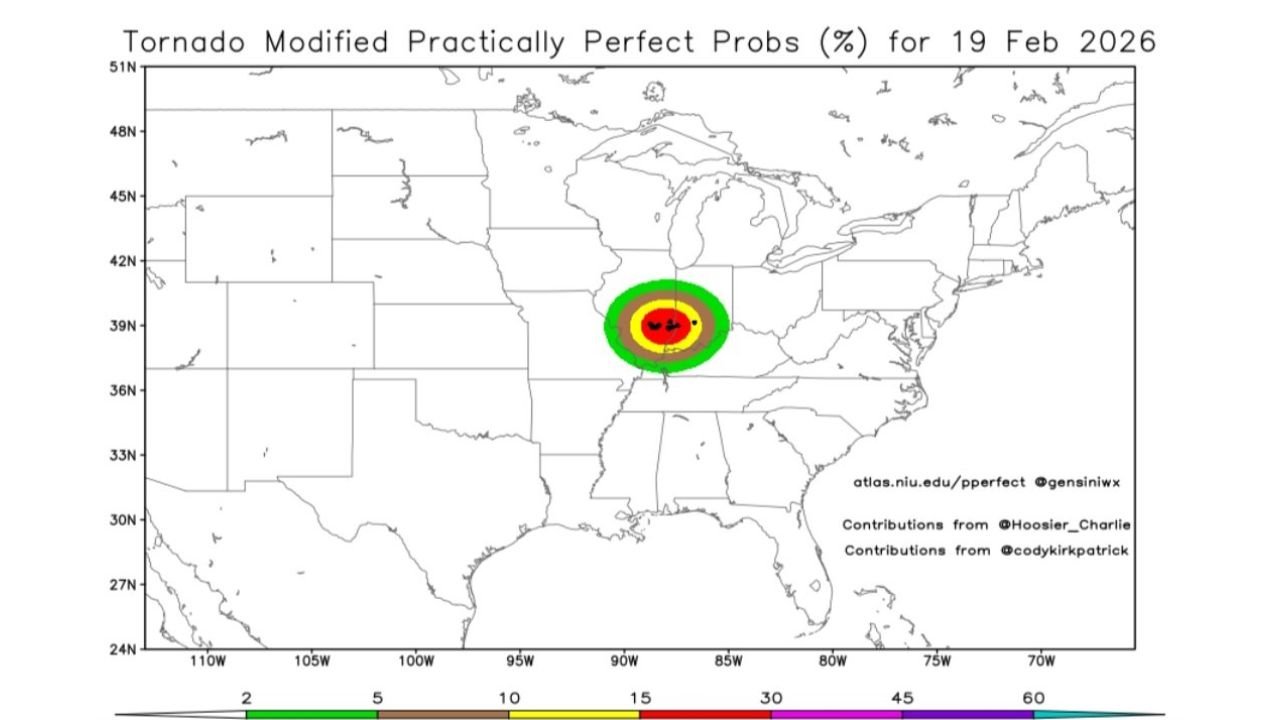
The updated “Tornado Modified Practically Perfect Probs (%)” map highlights a concentrated bullseye centered near the Illinois–Indiana border, with the highest verification percentages clustered across parts of central Illinois and western Indiana.
Core Impact Zone Over Illinois and Indiana
The verification graphic shows:
- A tight red and yellow bullseye centered across central Illinois into western Indiana
- Surrounding green and brown shading extending into eastern Missouri and southern Indiana
- Tornado reports plotted within that concentrated zone
This suggests that the area identified for tornado risk performed strongly in post-event analysis.
Why 10% Risk May Mean More Than It Sounds
Forecasters often note that a “10% tornado probability” does not mean tornadoes are unlikely. In fact, verification studies show that:
- Real-world events frequently verify at higher effective probabilities than public perception suggests
- Outlook probabilities are based on point-based verification methods
- Track-based verification would often show even stronger performance
In other words, a 10% area is far from minor. Historically, it can represent a meaningful and focused tornado threat.
SPC Bias Adjustments and Ongoing Improvements
Meteorologists have acknowledged a documented low-bias tendency in past outlooks. The Storm Prediction Center (SPC) has been actively refining methodology in recent years.
This event’s verification map reinforces that outlook areas — especially in the Midwest — can perform strongly even when probabilities appear modest on paper.
Geographic Focus: Midwest Tornado Corridor
The February 19 event’s strongest verification centered over:
- Central Illinois
- Western Indiana
- Eastern Missouri
This region lies within the broader Midwestern tornado corridor, where winter and early spring systems can produce compact but impactful severe weather setups.
While the map shows no widespread national outbreak, it highlights how localized but concentrated tornado activity can verify tightly within a forecast zone.
What This Means Going Forward
For residents in states like Illinois, Indiana, Missouri, Kentucky, and Ohio, this event is a reminder that even moderate probability outlooks deserve attention.
A 10% tornado area may sound small compared to higher categorical risks, but historically it can correspond to:
- Focused tornado clusters
- Strong local impacts
- High verification confidence after the event
Bottom Line
The February 19 tornado event across Illinois and Indiana demonstrates that moderate probability outlooks can verify strongly and that public perception of risk percentages often underestimates real-world impact.
For Midwest residents, the takeaway is clear: when your county is inside a defined tornado probability zone, preparation matters — even if the number looks modest.
Stay with Waldronnews.com for continued severe weather coverage and analysis across the United States.