
Large Swath of Central and Eastern United States Flagged for Increased Severe Weather Risk From Mid-March Through July 2026
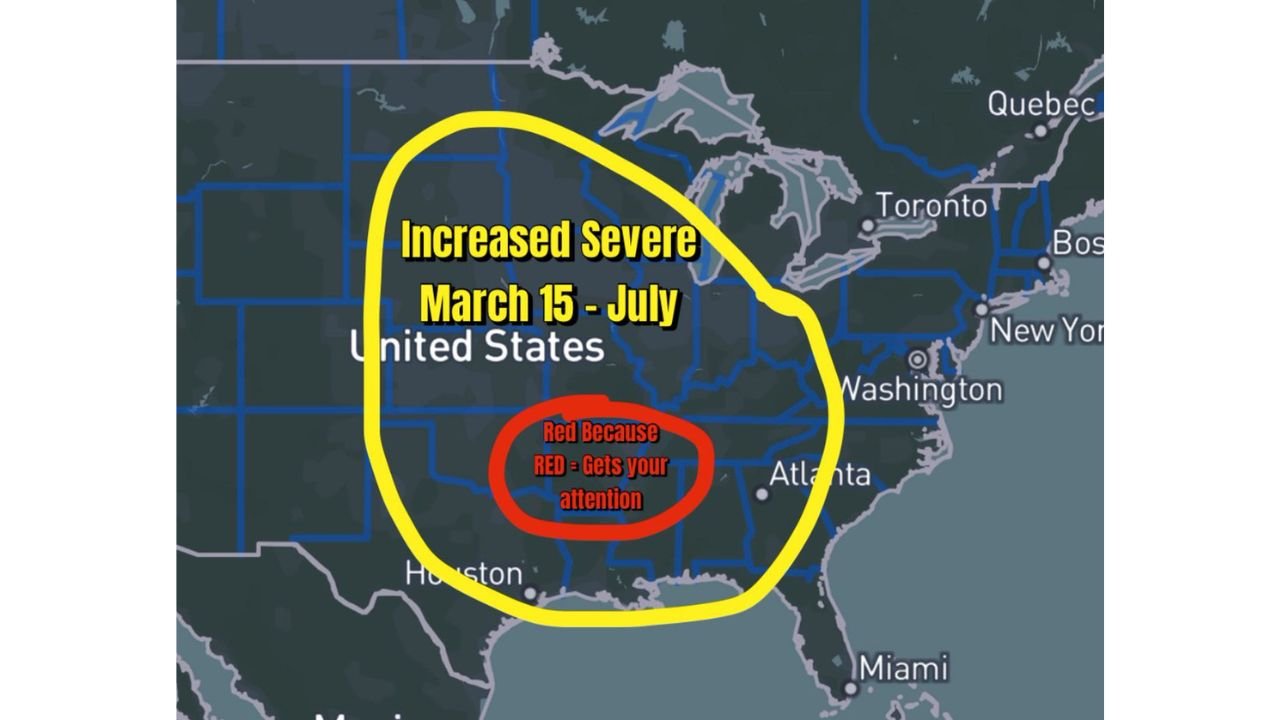
UNITED STATES — A newly shared 2026 severe weather outlook graphic highlights a broad portion of the country expected to see increased severe weather potential between March 15 and July, covering much of the central, southern, and eastern United States.
The map outlines a wide zone stretching from Texas and the Gulf Coast northward through the Plains, Midwest, Ohio Valley, and into parts of the Northeast, signaling a prolonged seasonal window where conditions may favor more frequent or impactful severe weather episodes.
Highlighted Risk Area Spans Multiple Major Regions
The highlighted region encompasses a large portion of the country, including:
- Texas and the Gulf Coast
- The Lower and Mid-Mississippi Valley
- Parts of the Southern Plains
- The Tennessee and Ohio Valleys
- Portions of the Mid-Atlantic and interior Northeast
Major metro areas shown near or within the outlined zone include Houston, Atlanta, Washington, New York, and surrounding population centers, emphasizing the potential for widespread exposure during the peak severe season.
Timing Focused on Core Severe Weather Months
The outlook specifically identifies the period from March 15 through July, which traditionally aligns with the core severe weather season across much of the United States.
This timeframe typically corresponds with:
- Increasing warmth and instability during spring
- Stronger storm systems moving across the central U.S.
- Peak overlap of moisture, wind shear, and frontal boundaries
The graphic labels this window as “Increased Severe”, indicating a heightened overall seasonal signal rather than a single event.
Broad Signal, Not a Day-by-Day Forecast
It is important to note that the graphic represents a seasonal outlook, not a forecast for specific storms, dates, or locations. The wide yellow outline reflects a generalized risk corridor, not guaranteed impacts everywhere within the zone.
The image itself includes a note clarifying that the highlighted color is used for visibility and emphasis, reinforcing that this is a conceptual risk area rather than a precise probability map.
What This Means Going Forward
For communities within the highlighted region, the outlook suggests:
- A higher likelihood of severe weather setups during the spring and early summer months
- The need for continued awareness and preparedness as the season approaches
- Greater importance of monitoring short-term forecasts and watches once the season begins
Seasonal outlooks like this are often used as an early heads-up, helping emergency managers, utilities, and residents prepare for the months when severe storms are most likely to occur.
WaldronNews.com will continue tracking long-range outlooks, regional signals, and any updates that refine where and when severe weather threats may increase as 2026 approaches.