
Pennsylvania, New Jersey, and New York Snowstorm Delivers Accurate Jackpot Zone as Forecast Matches Reality
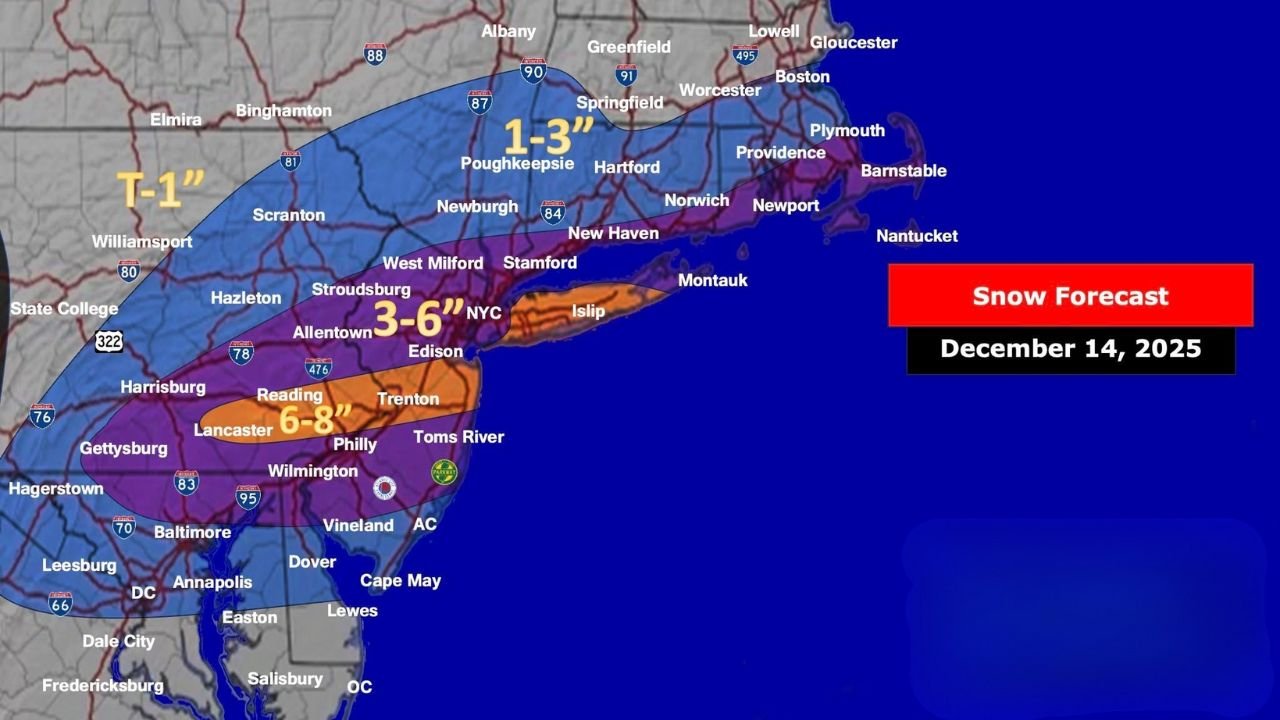
NEW YORK — A winter storm that moved through the Mid-Atlantic and Northeast on December 14, 2025, delivered snowfall amounts that closely matched pre-storm forecasts, with the heaviest accumulations verifying across parts of Pennsylvania, New Jersey, and Long Island, New York.
Post-storm snowfall reports and observation data confirm that the jackpot band set up where expected, while a sharp cutoff to the north and south limited accumulations outside the core zone.
Forecast vs. Reality: How the Snowfall Verified
Pre-storm forecast maps showed a focused band of heavier snowfall stretching from eastern Pennsylvania through central and southern New Jersey and into Long Island. Observation data collected after the storm shows that this corridor received the highest totals.
“Not perfect, but this was a case where it paid off to be bullish,” the forecaster noted, citing confidence based on meteorology and pattern recognition.
The sharp gradient in snowfall amounts — a hallmark of this event — was well captured by the forecast.
Jackpot Zone Confirmed Across PA, NJ, and Long Island
Snowfall reports highlight how accurately the highest-impact zone verified:
- Perrysburg, NY: 18.5 inches (highest total)
- Morgantown, WV: 12 inches
- Pittsburgh, PA: 7 inches
- Philadelphia, PA: 6 inches
- Newark, NJ: 5 inches
- New York City, NY: 4 inches
- Baltimore, MD: 2 inches (outside core band)
The most consistent 6–8 inch totals were concentrated from southeastern Pennsylvania into central New Jersey, with slightly lower totals northward into New York City and southern New England.
Sharp Snowfall Cutoff Verified
One of the most challenging aspects of the forecast was the tight snowfall gradient, where totals dropped off quickly just miles away from the main band.
Observation maps confirm:
- Heavier snow aligned closely with forecasted zones
- Northern and southern edges saw rapid decreases in accumulation
- Areas just outside the band received significantly less snow
“Capturing both the jackpot band and the sharp cutoff was key,” the forecaster said when reviewing the outcome.
Why This Forecast Worked
Meteorologists point to several factors that helped the forecast verify well:
- Strong mesoscale forcing
- Well-defined thermal boundaries
- Consistent model agreement on band placement
- Willingness to lean bullish where confidence existed
While no forecast is flawless, the overall structure and placement of snowfall matched expectations closely enough to be considered a successful verification.
How Would You Grade the Forecast?
With snowfall totals largely aligning with projections across Pennsylvania, New Jersey, and New York, this storm stands as an example of when confidence in pattern recognition paid off.
Readers are encouraged to review the snowfall maps and observations and decide for themselves.
What grade would you give this forecast — and how did conditions compare where you live? Share your experience with WaldronNews.com.