
Why Washington State, Georgia, Florida, and the Midwest Experience Such Different Rainfall: New Nationwide Data Reveals a Sharp U.S. Precipitation Divide
UNITED STATES — Newly compiled national precipitation data is revealing a dramatic divide in how much moisture different regions of the country receive each year, with Washington State, the Southeastern U.S., and parts of the Midwest ranking among the nation’s wettest zones, while vast portions of the West continue to struggle with significantly lower rainfall totals. The dataset—built from thousands of observation points—shows a clear pattern that helps explain long-standing differences in climate, agriculture, drought vulnerability, and regional water supply.
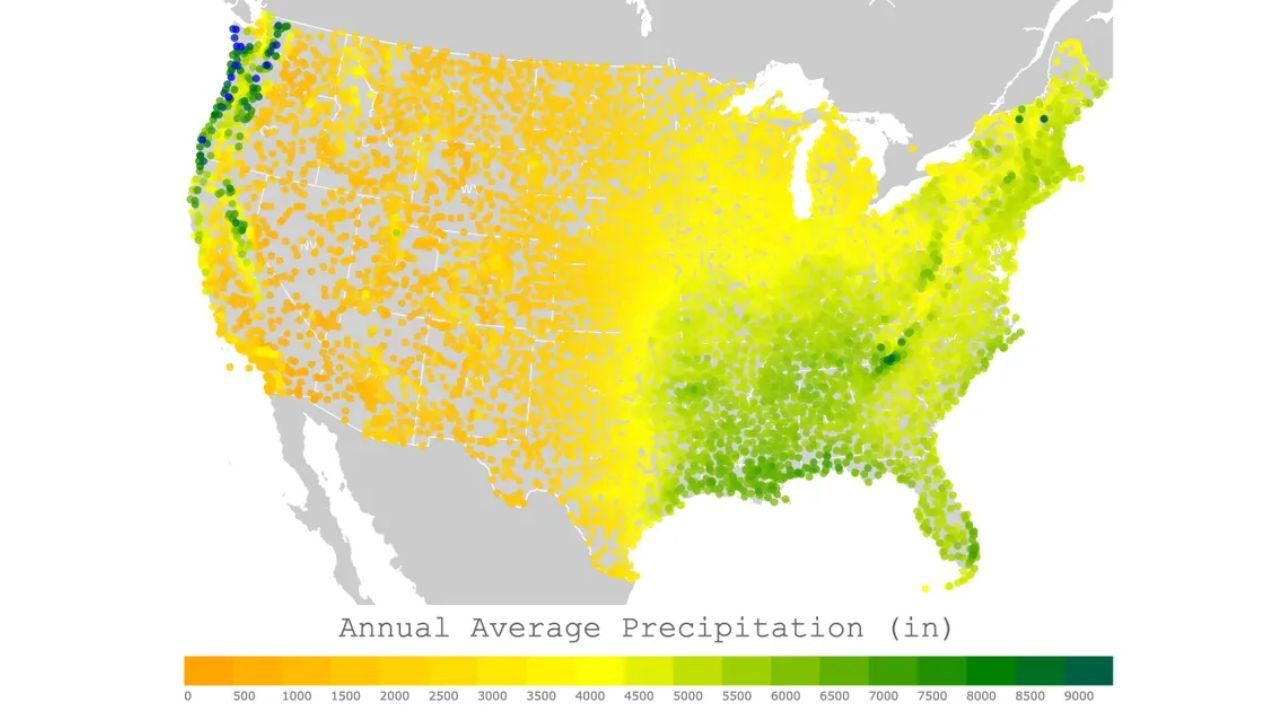
The visualized map illustrates not just local averages, but the true scale of the East–West moisture imbalance, offering one of the clearest side-by-side comparisons for understanding the country’s highly varied climate systems.
Pacific Northwest: Washington State Leads the Nation in Annual Precipitation
The map highlights a major precipitation maximum along the Washington coastline and the western slopes of the Cascades, where totals frequently exceed 80 to 100 inches per year—the highest concentration of rainfall anywhere in the contiguous United States.
Key factors driving this include:
- Persistent Pacific storm tracks
- Strong onshore flow that funnels moisture inland
- Rapid terrain uplift that forces clouds to release heavy precipitation
These conditions create lush forests, powerful river systems, and one of the most water-rich ecosystems in the country. In contrast, just east of the Cascades, rainfall totals drop sharply, underscoring the dramatic effect of Washington’s mountain barriers.
Interior West: Nevada, Utah, and Arizona Stand Out as the Nation’s Driest Region
The map clearly shows the Interior West—including Nevada, Utah, Arizona, and New Mexico—as the driest stretch of the United States, with many locations receiving 10–20 inches of precipitation annually, and even less in desert regions.
Major contributors to this dryness include:
- The rain shadow effect of the Sierra Nevada and Rocky Mountains
- Limited access to Gulf or Pacific moisture
- A semi-arid climate prone to multi-year drought cycles
This region continues to face long-term challenges related to water supply, wildfire risk, and agricultural sustainability. The new precipitation map reinforces why these states depend so heavily on snowpack, reservoirs, and interstate water agreements.
Central United States: A Transition Zone From Dry West to Wet East
As the map moves eastward across states like Kansas, Nebraska, Iowa, and Missouri, a gradual gradient emerges. The Central U.S. receives more moisture than the West but far less than the East, with typical annual totals ranging from 25 to 45 inches.
This region’s precipitation is largely driven by:
- Interactions between Gulf humidity and dry continental air
- Seasonal thunderstorms
- Occasional influence from tropical remnants
The variability makes the Plains and Midwest highly productive agriculturally—but also prone to rapid shifts between drought and flooding.
Southeastern States: One of the Nation’s Largest Rainfall Hotspots
The Southeastern U.S.—including Georgia, Alabama, Mississippi, the Carolinas, and northern Florida—forms another major rainfall maximum, with many locations consistently recording 50–70 inches per year.
These high totals are driven by:
- Warm, moisture-rich Gulf air
- Frequent thunderstorms
- Tropical storms and hurricanes
- Humid air masses that dominate much of the year
This steady supply of moisture supports dense vegetation and long growing seasons, but also contributes to flash flooding, severe weather events, and high humidity levels.
Northeast and Mid-Atlantic: Moderate to High Rainfall, Spread Across All Seasons
The Northeast—including Pennsylvania, New York, New Jersey, and New England—receives 40–55 inches annually, placing it solidly on the wetter side of the national spectrum.
The region’s rainfall is distributed throughout the year thanks to:
- Nor’easters
- Coastal systems
- Seasonal frontal boundaries
Though not as wet as the Pacific Northwest or Southeast, the Northeast’s consistent precipitation supports major rivers, hydropower infrastructure, and agriculture.
Regional Comparison: A Nation Defined by Moisture Extremes
The new precipitation dataset underscores several clear national trends:
- Washington State and the Pacific Northwest receive the most rainfall in the contiguous U.S.
- The Interior West remains the driest and most drought-vulnerable region.
- The Southeast rivals the Pacific Northwest in total moisture, though from completely different weather systems.
- The Central U.S. forms a transition belt where rainfall increases steadily eastward.
- The Northeast enjoys reliable, year-round precipitation.
These regional differences shape everything from wildfire risk to crop selection, water-resource planning, and even population distribution.
Stay Ahead of Weather Trends With WaldronNews.com
As climate patterns continue to shift and regional extremes grow more pronounced, staying informed is essential. Follow WaldronNews.com for deeper climate insights, state-by-state comparisons, and the latest data shaping America’s weather landscape.