
Energy Markets Watch April 6 to 12 as Heating Degree Days Approach Average With Strong Cold Front and GEFS Models Signal Slightly Warmer Trends Possible for Central United States
UNITED STATES — A critical energy demand forecast window is shaping up for the week of April 6 through April 12, 2026, as a strong cold front passing through from the 9th to the 11th is expected to push Heating Degree Days (HDDs) as close to average as forecasters expect to see for the rest of early spring. The BAM Week 2 GWHDDs Outlook places total Gas-Weighted Heating Degree Days at 90 for the April 6–12 window — below both the 10-year average of 95.63 and the 30-year average of 98.52 — signaling a below-normal but meaningful heating demand period. The NOAA GEFSv12 7-day average temperature anomaly ensemble, initialized March 29, 2026, shows a striking contrast across the continental United States, with the central and eastern US notably cooler than normal while the western US runs significantly above normal.
The Numbers — Week 2 GWHDDs Outlook April 6 to 12
The BAM GWHDDs forecast for the April 6–12, 2026 period shows:
- 10-Year Average GWHDDs: 95.63
- 30-Year Average GWHDDs: 98.52
- BAM Forecast GWHDDs: 90 — below both historical averages
- Gap from 10-year average: approximately 5.63 GWHDDs below normal
- Gap from 30-year average: approximately 8.52 GWHDDs below normal
The below-average GWHDD total reflects the overall warmer-than-normal early spring pattern, partially offset by the strong cold front from the 9th through the 11th that will provide the most meaningful heating demand of the early spring period.
Temperature Anomaly Pattern — April 6 to 13 Across the United States
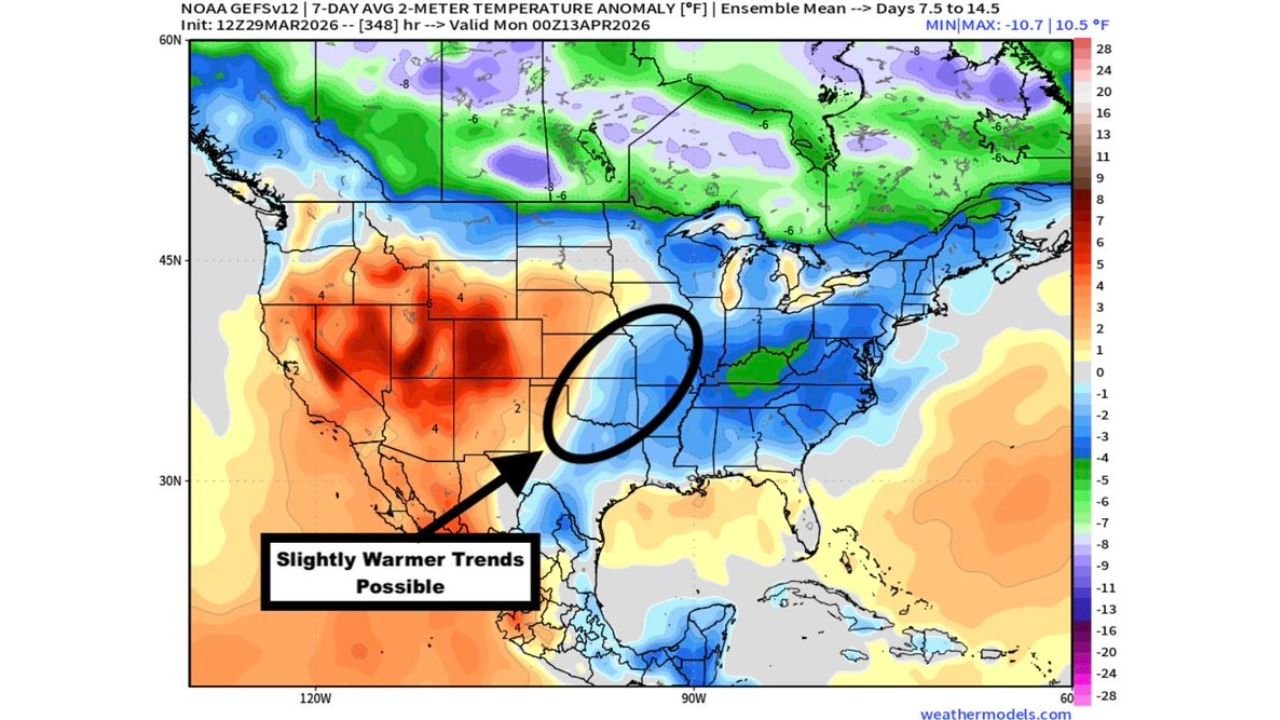
The NOAA GEFSv12 ensemble mean for the 7-day average 2-meter temperature anomaly, valid through April 13, 2026, shows dramatically different conditions across different parts of the continental United States:
Significantly Above Normal — Western US:
- Nevada, Utah and the Desert Southwest — 6 to 10°F or more above normal
- California and the Pacific Coast — above-normal temperatures persisting
- Montana and northern Rockies — above-normal anomalies extending into the northern tier
Below Normal — Central and Eastern US:
- Kansas, Missouri and the central Plains — 2 to 4°F below normal within the circled zone of slightly warmer trends possible
- Great Lakes region — 4 to 6°F below normal
- Ohio Valley, Kentucky and Tennessee — below-normal temperatures through the period
- Northeast and New England — 2 to 4°F below normal
- Canada — 6°F or more below normal across the northern tier
Slightly Warmer Trends Possible:
- The NOAA GEFS ensemble annotates a zone across the central Plains — Kansas, Missouri and Iowa corridor as having “slightly warmer trends possible” — an area where the latest EPS (European ensemble) shows a somewhat warmer solution that may hold merit depending on how the ridge evolves over the next couple of days
Why the GEFS vs EPS Model Comparison Matters for Energy Demand
The critical uncertainty in the April 6–12 energy demand forecast comes down to how the ridge evolves over the next couple of days. Forecasters are currently leaning GEFS — which shows the cooler solution for the central and eastern US — but acknowledge that the latest EPS is hinting at a slightly warmer outcome, particularly for the central Plains corridor currently circled on the NOAA anomaly map.
If the EPS warmer trend holds merit, it would reduce heating demand across the Kansas, Missouri, Iowa and Nebraska corridor during the April 6–12 window — potentially pushing the BAM GWHDD total below 90 and further from the historical averages. If the GEFS cooler solution verifies, the strong cold front from April 9 to 11 delivers the closest approach to average HDDs that the early spring period is likely to produce — supporting the 90 GWHDD forecast.
The Strong Cold Front — April 9 to 11
The strong cold front passing through from April 9 to 11 is the key driver of whatever heating demand materializes during the April 6–12 window. This frontal system will push temperatures well below the warm pre-frontal readings and deliver the most significant HDD accumulation of the early spring — making it the most important weather feature for natural gas demand during this period.
Without this front, the April 6–12 GWHDD total would likely fall even further below historical averages. With it, the period reaches the 90 GWHDD level — the closest to normal that forecasters expect to see for early spring 2026.
What to Watch Next
Key details for energy traders, utilities and forecasters monitoring the April 6–12 demand outlook:
- Ridge evolution over the next 1 to 2 days — determines whether GEFS or EPS solution is correct for the central Plains
- April 9 to 11 cold front timing and intensity — the primary HDD-generating event of the week
- BAM GWHDD revision — watch for updates as model confidence improves heading into the week
- Central Plains temperature trend — Kansas, Missouri and Iowa are the swing states for the GWHDD total
- EPS vs GEFS comparison — any convergence toward the warmer EPS solution would reduce heating demand estimates
- Post-April 12 pattern — whether another cold shot follows or the pattern shifts warmer heading toward mid-April
WaldronNews.com will continue monitoring the April 6–12 energy demand outlook and provide updated GWHDD forecasts and temperature anomaly analysis as model runs evolve heading into the critical early April period.