
California, Oregon, Washington, Nevada and Arizona Snowpack Falls Below 50 Percent as Westwide Map Shows Widespread Deficits
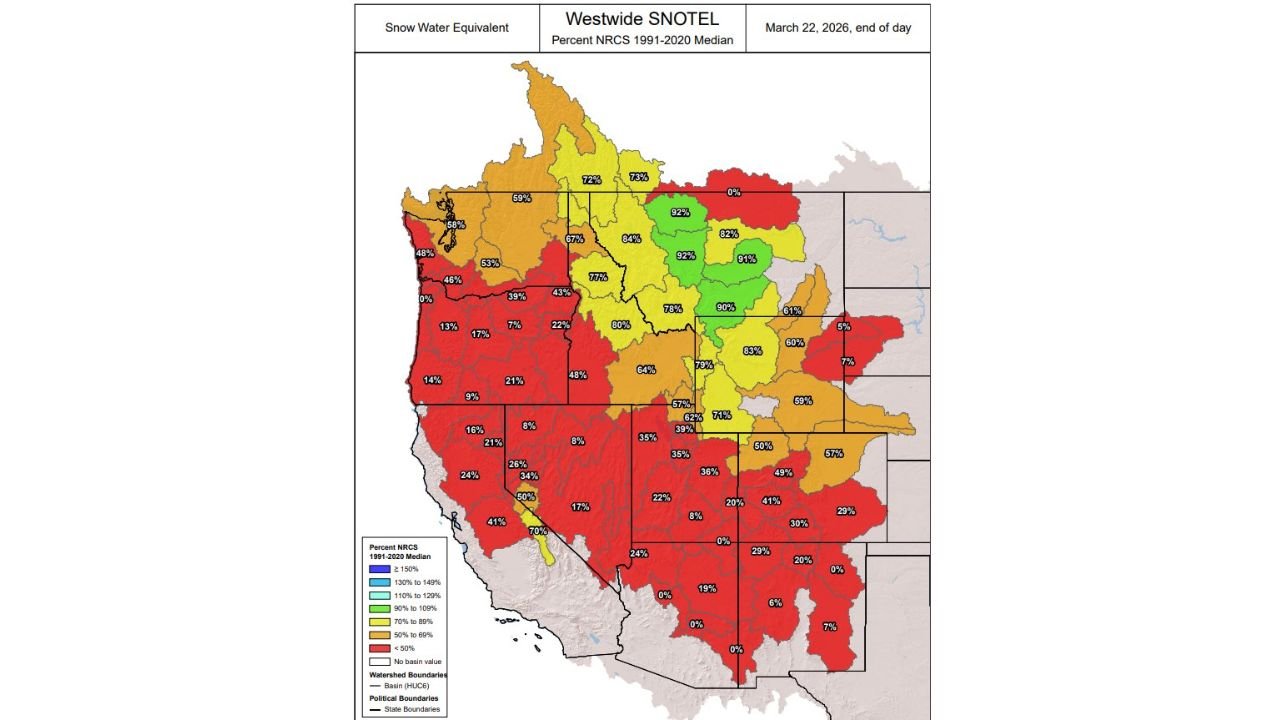
WESTERN UNITED STATES — An updated snow water equivalent (SWE) map released March 22, 2026 shows troubling conditions across much of the West, with large portions of California, Oregon, Washington, Nevada and Arizona reporting snowpack levels below 50 percent of the 1991–2020 median.
The Westwide SNOTEL map highlights extensive red shading across the Southwest and Pacific Coast states — indicating basins at less than half of their normal snowpack for this time of year.
California and Arizona Among Hardest Hit
Much of California is showing severe deficits:
- Many basins across the Sierra Nevada are in the single digits to 30 percent range
- Several southern and interior basins are reporting near 0 percent
- Even stronger-performing northern zones remain well below normal
In Arizona, most mountain basins are also reporting deep deficits, with many areas between 0 and 30 percent of median, and several at or near zero.
Nevada and Oregon Largely Below Half of Normal
Across Nevada, widespread basins are registering under 50 percent of normal snowpack, with several zones between 20 and 40 percent.
In Oregon, western and southern portions of the state show significant deficits — many basins in the red category — while some central and northern areas are faring slightly better but still below ideal levels.
Washington Mixed but Trending Low
In Washington, snowpack conditions are somewhat more variable:
- Northern and interior regions show values in the 50–70 percent range
- Western and southern basins dip closer to 40–50 percent
Even where conditions are less dire than farther south, most of the state remains below the long-term median.
Northern Rockies Performing Better
In contrast, parts of Idaho, Montana and Wyoming show stronger snowpack numbers:
- Several basins in western and central Montana range between 70 and 90 percent
- Isolated areas approach or exceed 90 percent of median
However, even these regions are not universally above average, and some northern basins still show patchy deficits.
What the Numbers Mean
The map reflects percent of the NRCS 1991–2020 median, meaning:
- Green areas (near 90–100%) are close to normal
- Yellow and orange zones (50–80%) are below normal
- Red zones (under 50%) signal significant snowpack shortages
With late March typically marking peak accumulation for many Western basins, these percentages suggest limited opportunity for recovery before melt season accelerates.
Water Supply and Fire Season Concerns
Snowpack acts as a natural reservoir, gradually releasing water into rivers and reservoirs during spring and summer.
Below-normal snowpack across California, Nevada, Arizona, Oregon and Washington could result in:
- Reduced runoff
- Lower reservoir recharge
- Increased drought vulnerability
- Earlier wildfire season onset
The widespread nature of the deficits — particularly across the Southwest — makes the trend especially concerning.
The Bottom Line
The latest Westwide snowpack map shows large portions of California, Oregon, Washington, Nevada and Arizona running well below seasonal norms, with many basins under 50 percent of median and some near zero.
With peak snowpack season nearly behind us, the window for meaningful improvement is narrowing.
Stay with WaldronNews.com for continued coverage of critical weather and water developments across the United States.