
A Winter-Like Upper Air Pattern Returns to the Central and Eastern United States by May 8 and Severe Weather Chasers Are Already Taking Notice
KANSAS CITY, Missouri — Something remarkable is showing up in the early May upper atmosphere forecast that has meteorologists and severe weather chasers doing a double take. The 500 millibar height pattern valid for Friday, May 8, 2026 is not what a typical early May atmosphere looks like over the United States — it is what a classic winter severe weather setup looks like, the kind of pattern that dominated all winter long and is now reappearing just as spring is supposed to be settling in. The result for the central and eastern United States is a pattern that could suppress organized severe weather for 2 to 3 weeks while delivering anomalously cold and unsettled conditions across a wide area.
What the May 8 Upper Air Map Is Actually Showing
Before breaking down the impacts, it helps to understand what 500 millibar height means and why this map is so striking to anyone who follows weather patterns.
| Term | Plain Language Explanation |
|---|---|
| 500 mb height | The altitude where atmospheric pressure equals 500 millibars — roughly 18,000 feet up. Lower values mean colder air. Higher values mean warmer air. |
| Dam (decameters) | The unit used to measure height on this map. Lower numbers = colder, deeper troughs. Higher numbers = warmer ridges. |
| Wind barbs | The small flag symbols showing wind direction and speed at 18,000 feet — these steer surface weather systems |
| Blue/purple shading | Cold air — well below normal heights for early May |
| The trough | The dip in the contour lines over the central US — this is the cold air digging southward |
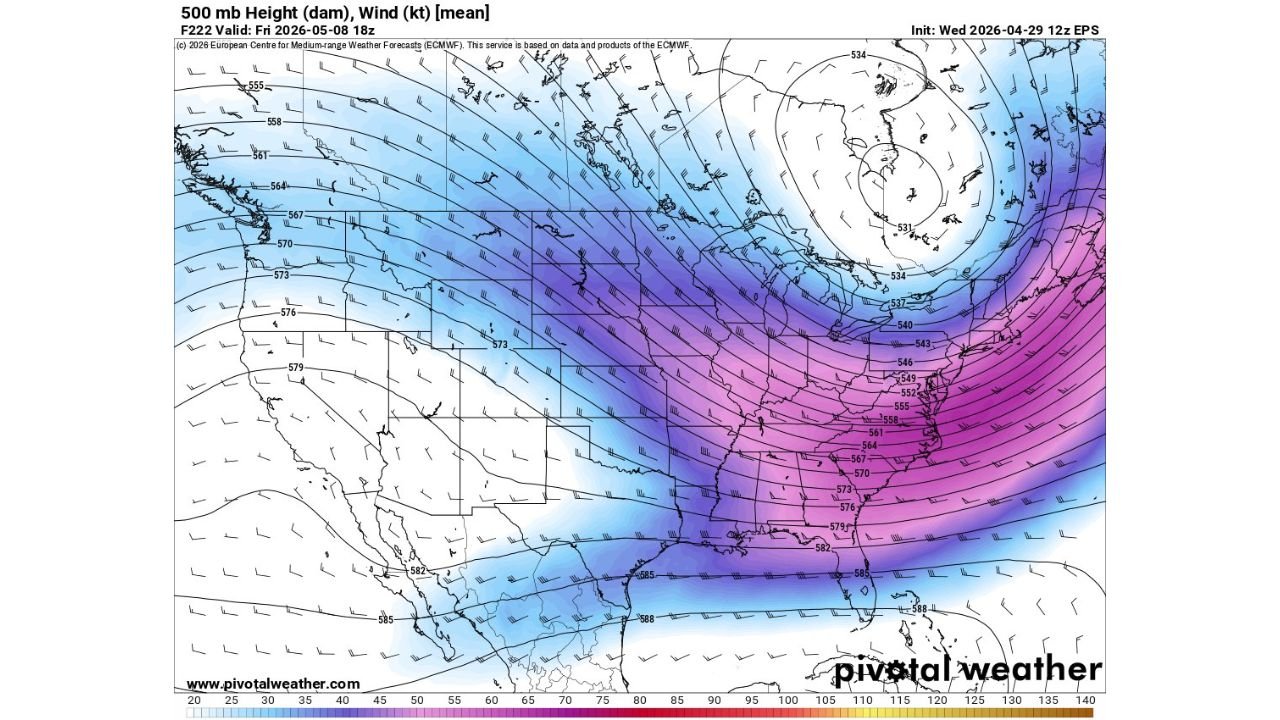
The map shows height values of 531 to 534 decameters over the northeastern United States and Canada — numbers more consistent with a January pattern than early May. Meanwhile a deep trough is carving through the central United States with the tight gradient of contour lines indicating strong upper level winds and an active storm track.
Why Meteorologists Are Calling This Pattern Remarkable
| What Makes This Pattern Unusual | Detail |
|---|---|
| Time of year | May 8 — deep spring. This pattern belongs in December or January. |
| How long this pattern dominated | All winter long — and now it is returning |
| What it means for severe weather | The classic spring severe weather setup gets disrupted |
| Upper level wind direction | Strong flow from northwest — cold air advection into the central US |
| Height anomaly | Values of 531 to 534 over the Northeast are 20 to 30 dam below normal for May |
| What forecasters are saying | Storm chasers joking they will see no action for 2 to 3 weeks |
The reason storm chasers are half-joking about disappearing for 2 to 3 weeks is that this upper air pattern is not favorable for the classic Plains severe weather setup. The northwest flow regime visible on the map keeps cold air drilling into the central United States from Canada, which suppresses the warm, unstable air masses that fuel tornado outbreaks across Kansas, Oklahoma, and Texas. Instead of warm Gulf air surging northward to clash with cold fronts, the cold air wins — repeatedly.
How the 500 mb Pattern Steers Everything Below It
Most people only see surface weather — rain, wind, temperature. But everything happening at the surface is controlled by what is happening at 18,000 feet above. Here is the direct connection.
| Upper Air Pattern | What It Produces at the Surface |
|---|---|
| Deep trough over central US | Cold temperatures, stormy conditions, unsettled weather |
| Strong northwest flow | Repeated cold air pushes southward into the Plains and Midwest |
| Low height values (531-534 dam) | Below normal temperatures across the Northeast and Great Lakes |
| Tight contour gradient | Strong jet stream — fast-moving systems, quick temperature changes |
| Ridge over the West (579-585 dam) | Warm and dry conditions from California through the Southwest |
The ridge parked over the western United States — shown by the high values of 579 to 585 decameters from California through the Southwest — acts as a block. It forces the jet stream to dig sharply southward over the central Plains before lifting out to the northeast. That sharp dip is the trough. And that trough is what is replicating winter conditions in early May.
Which Parts of the Country Feel This Pattern Most
| Region | What This Pattern Means for Them |
|---|---|
| Central Plains — Kansas, Oklahoma, Nebraska | Cold, below normal temperatures. Classic severe weather pattern suppressed. |
| Midwest — Missouri, Illinois, Indiana, Ohio | Repeated cold shots, unsettled conditions, below normal temps |
| Northeast — New York, Pennsylvania, New England | Well below normal heights — cold for early May, frost possible |
| Southeast — Tennessee, Kentucky, the Carolinas | Caught on the eastern edge of the trough — cooler and stormier than normal |
| Southwest — California, Arizona, Nevada | Warm and dry under the western ridge — opposite conditions from the East |
| Gulf Coast | Southern edge of the trough interaction — storm track active but shifted |
What This Means for the Next 2 to 3 Weeks
The practical impact of this pattern locking in through mid-May is significant for millions of people across the central and eastern United States.
For gardeners and farmers across the Midwest and Plains, this pattern extends the frost and freeze risk well beyond the typical last frost dates for many areas. Anyone waiting to plant warm-season crops should continue waiting — this upper air pattern does not support the warm nights needed for safe outdoor planting across Indiana, Ohio, Illinois, and the surrounding states.
For severe weather across the traditional tornado corridor in Kansas, Oklahoma, and Texas, this pattern is suppressive. The northwest flow regime keeps the warm, unstable air from building northward in the way needed for classic tornado outbreaks. Isolated severe weather remains possible on the edges of the trough, but the extended outbreak setups that define peak tornado season become much less likely while this configuration holds.
For temperatures across the Northeast and Great Lakes, the 531 to 534 decameter values over the region translate directly to below normal surface temperatures that could persist for 2 to 3 weeks if the pattern holds as forecast through May 8 and beyond.
What to Watch as This Pattern Develops
- Whether the trough deepens further or begins to retrograde westward — a deeper trough means colder and longer suppression of severe weather across the Plains
- Frost and freeze watches across the Midwest and Northeast as each cold push associated with this trough brings overnight lows into dangerous territory for late April and early May plantings
- Any shortwave energy rotating through the northwest flow that could trigger isolated severe weather on the eastern edge of the trough — even suppressed patterns produce severe weather in the right locations
- When the pattern finally breaks down — the transition out of a locked northwest flow regime often produces an explosive severe weather outbreak as warm Gulf air surges back northward rapidly
- Temperature records across the Northeast — the height values shown over New York and New England for May 8 are cold enough to threaten daily low temperature records if the pattern verifies
WaldronNews.com will continue tracking this developing upper air pattern through early May and provide updates as the forecast evolves and impacts on temperatures, frost risk, and severe weather become clearer.