
Atlantic Ocean Sea Surface Temperatures Tell a Divided Story on April 28 as Gulf of Mexico Runs Warm While North Atlantic Stays Significantly Below Normal
MIAMI, Florida — Sea surface temperature data from April 28, 2026 reveals a dramatically divided Atlantic Ocean, with the Gulf of Mexico and tropical Atlantic running warmer than normal while a large portion of the North Atlantic sits significantly below average, a pattern with direct implications for the upcoming hurricane season and global weather patterns heading into summer.
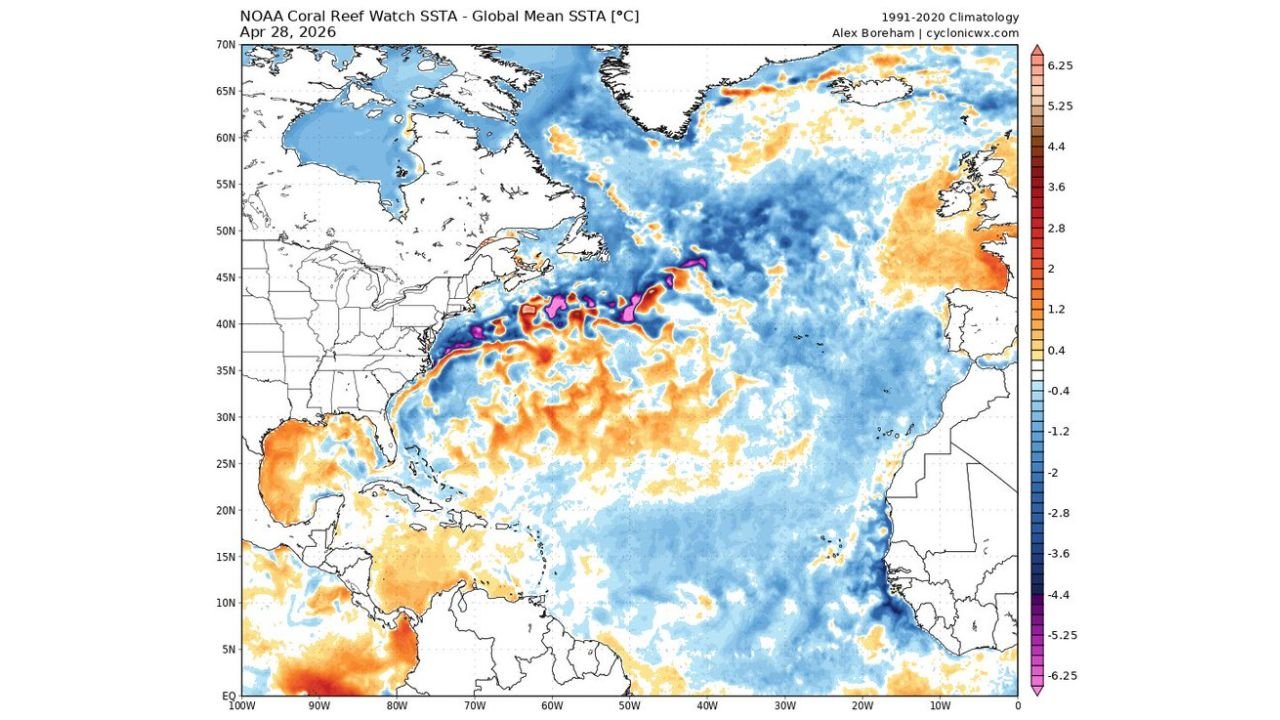
Why Two Maps Tell Different Stories
Two separate sea surface temperature products were compared for April 28, 2026, and they paint noticeably different pictures of ocean heat:
- The first map uses an outdated climatology baseline from 1985 to 1990, making ocean temperatures appear unrealistically warm across broad areas. Its color scale also flags anything even slightly above zero as yellow, exaggerating warmth visually
- The second map uses a 1991 to 2020 climatology baseline with the global mean anomaly removed, giving a far more accurate and honest comparison between ocean basins
The second and more accurate map is the one that matters for understanding actual conditions.
What the Accurate Data Actually Shows
Using the 1991 to 2020 baseline, the North Atlantic picture looks very different from what the first map suggests:
Warmer Than Normal Areas:
- Gulf of Mexico — running above average, a concern for early hurricane season fuel
- Tropical Atlantic near the Caribbean — warmer than normal pockets present
- Eastern Atlantic near Europe and West Africa — above average temperatures visible
Cooler Than Normal Areas:
- North Atlantic between 40°N and 60°N — a large and persistent below-normal zone dominates, shown in blue
- Gulf Stream region off the US East Coast — dramatically below normal with magenta patches indicating anomalies of minus 5 to minus 6.25 degrees Celsius, the most extreme cold departure on the entire map
- Waters off New England, Nova Scotia and the mid-Atlantic coast — significantly cooler than the 1991 to 2020 average
What This Means for Hurricane Season
The contrast between a warm Gulf of Mexico and a cold North Atlantic is a pattern forecasters watch closely heading into Atlantic hurricane season:
- Warm Gulf of Mexico waters provide readily available energy for any storm that enters the Gulf
- The cold North Atlantic anomaly can influence how storms track once they move off the US East Coast
- The extreme cold pool near the Gulf Stream off New England is an unusual and notable signal for late April
What to Watch Going Forward
- Monitor whether the North Atlantic cold anomaly persists or weakens heading into June and July, as persistent cold in that region can affect both hurricane tracks and European weather patterns
- The Gulf of Mexico warmth should be watched closely as hurricane season officially begins June 1
- Sea surface temperature patterns in April and May are among the most reliable early indicators of how active and how dangerous the coming hurricane season may be
WaldronNews.com will continue tracking Atlantic and Gulf of Mexico sea surface temperature patterns and will provide updated coverage as hurricane season approaches.