
Hurricane Forecast Cones Shrink Over 20 Years — But New ‘Intensity Cone’ Proposal Could Change How Florida, Gulf Coast and Caribbean Prepare for Rapidly Strengthening Storms
UNITED STATES — A growing discussion in the meteorological community is raising an important question about how hurricanes are communicated to the public. While track forecast cones from the National Hurricane Center (NHC) have steadily improved and narrowed over the past two decades, experts now suggest that the next evolution in storm forecasting may focus less on where a hurricane will go — and more on how strong it could become.
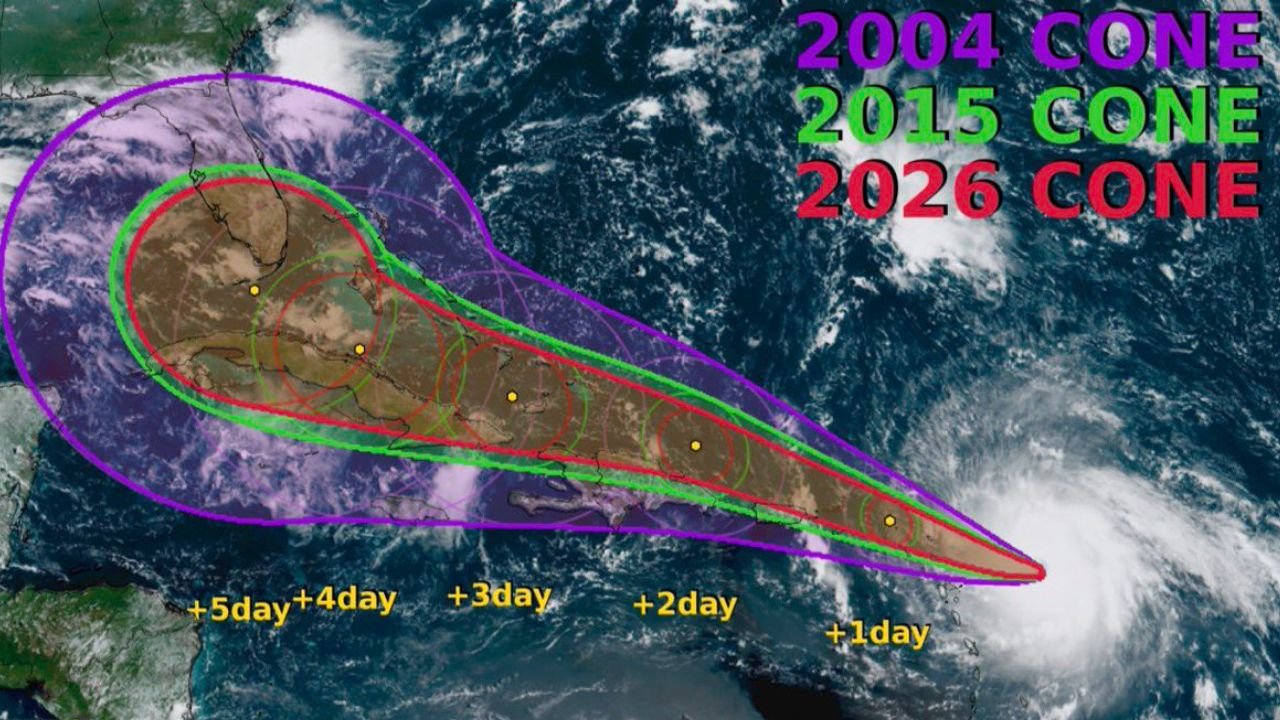
Recent analysis comparing forecast cones from 2004, 2015, and 2026 clearly shows how dramatically track accuracy has improved. The 2004 cone, displayed in purple, covers a wide swath of the Caribbean and Gulf of Mexico, stretching broadly from the Lesser Antilles toward Florida and the central Gulf Coast. By 2015, the green cone noticeably tightens. The 2026 version, shown in red, is even more refined, hugging the projected path far more closely.
Track Forecasts Have Improved Significantly Since 2004
Over the last 20 years, improvements in satellite data, aircraft reconnaissance, computer modeling, and data assimilation have allowed forecasters to reduce track errors substantially. The modern cone more accurately reflects the probable path of the storm center over five days.
For residents in hurricane-prone regions such as Florida, Louisiana, Texas, Mississippi, Alabama, and the Caribbean islands, this improvement has helped emergency managers make more targeted evacuation decisions and resource allocations.
However, while the cone has narrowed geographically, a critical challenge remains: intensity forecasting is still highly uncertain.
The Case for an “Intensity Cone”
One emerging idea gaining attention is the concept of an “intensity cone” — or an intensity range graphic — that would visually display the range of possible wind speeds a hurricane could reach over time.
A recent example intensity chart for a tropical storm forecast in 2026 illustrates this issue clearly. The red center line shows the official forecast intensity, increasing steadily from tropical storm strength into Category 3 or Category 4 hurricane status by around 96 hours. But the shaded area surrounding that line shows a wide range of possible outcomes.
By Day 4 or Day 5, the difference between the lower and upper intensity bounds can be significant — potentially representing the difference between a Category 2 and a Category 4 hurricane.
This kind of uncertainty became painfully evident in recent years with storms like Hurricane Otis (2023), which intensified rapidly and exceeded expectations just before landfall.
Why Intensity Is Harder to Predict
Track forecasts benefit from large-scale steering patterns in the atmosphere that are increasingly well modeled. Intensity, however, depends on more chaotic and localized factors, including:
- Ocean heat content
- Vertical wind shear
- Internal storm structure
- Eyewall replacement cycles
- Rapid intensification events
Rapid intensification — defined as an increase of at least 35 mph in 24 hours — remains one of the biggest forecasting challenges. Storms moving over very warm waters in the Gulf of Mexico or western Caribbean can strengthen far faster than earlier projections suggest.
For coastal states like Florida, Texas, and Louisiana, that intensity uncertainty can mean the difference between moderate wind damage and catastrophic structural impacts.
Benefits — and Risks — of an Intensity Cone
Supporters of the intensity range concept argue that it would:
- Better communicate worst-case scenarios
- Reduce public overconfidence in a single wind speed forecast
- Provide emergency managers with a more realistic risk envelope
Currently, many model intensity ranges are visible on specialized forecasting platforms such as Tropical Tidbits, but they are not part of the official NHC cone graphic seen by the general public.
However, critics caution that adding an intensity cone could also:
- Create confusion for the public
- Oversimplify an already complex science
- Lead to misinterpretation of worst-case shading as “guaranteed” outcomes
Communicating uncertainty is one of the most delicate tasks in weather forecasting. Too little information can lead to under-preparation. Too much complexity can overwhelm or confuse.
What This Means for the 2026 Hurricane Season
As the 2026 Atlantic hurricane season approaches, forecasters continue refining both track and intensity models. While the modern forecast cone is far more accurate than it was in 2004, the conversation is shifting toward how to better communicate strength uncertainty — especially in regions prone to rapid intensification events.
For residents along the Gulf Coast, Florida Peninsula, and Caribbean islands, the key takeaway remains unchanged:
Do not focus solely on the center line of the cone — and do not focus on a single wind speed number.
Storms can intensify faster than expected, and impacts extend well outside the narrow track path.
If adopted in the future, an official intensity cone could represent the next major shift in hurricane risk communication — helping communities better understand not just where a storm might go, but how dangerous it could ultimately become.
Stay with WaldronNews.com for continued updates on hurricane forecasting developments and preparedness guidance as the 2026 season approaches.