
Maryland, Virginia and Pennsylvania Face Growing Drought as Baltimore Runs 5.98 Inches Below Normal Since January 1 While Pittsburgh Sits 2 to 4 Inches Above Normal
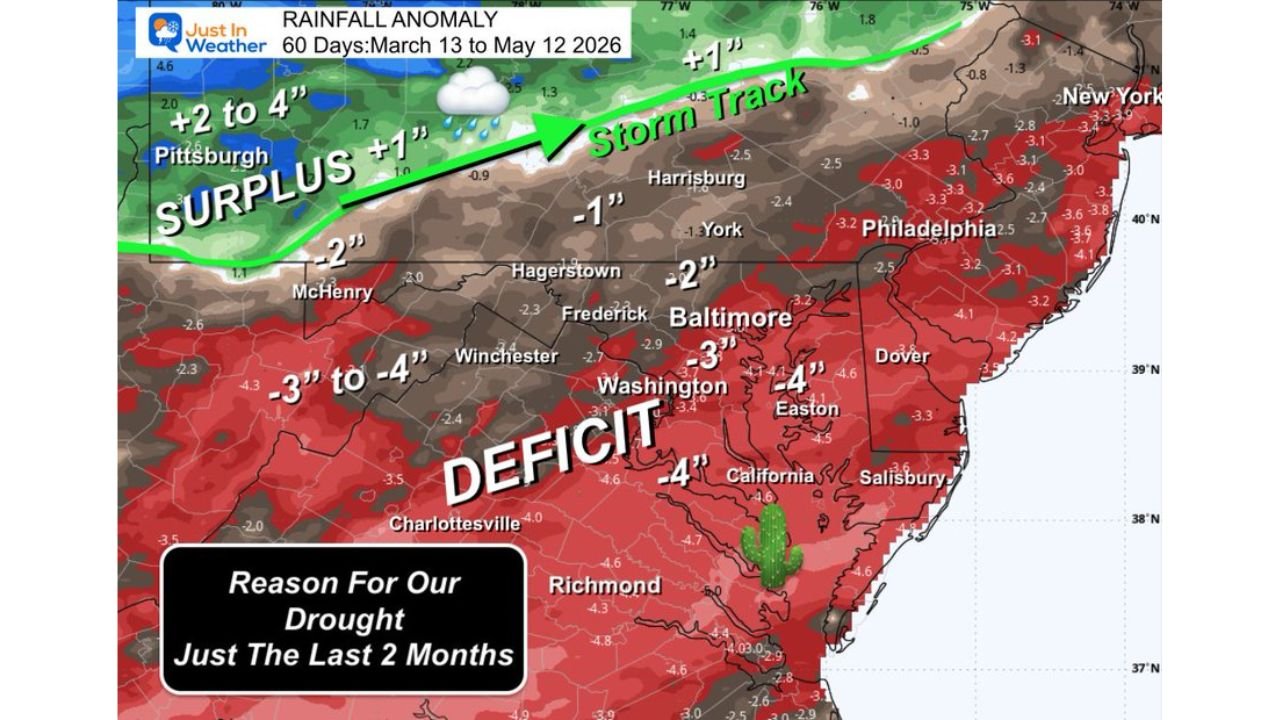
BALTIMORE, Maryland — A stark rainfall divide has been carving through the Mid-Atlantic region over the past 60 days, from March 13 through May 12, 2026, leaving Maryland and Virginia in a deepening drought while communities north of a sharp storm track boundary across Pennsylvania have seen surplus rainfall of 2 to 4 inches above normal.
Baltimore-Washington International Airport is running 5.98 inches below normal since January 1, one of the most significant rainfall deficits in the region and a number that clearly explains why drought conditions have been expanding across Maryland throughout the spring.
The Deficit Zone: Maryland, Virginia and Southern Pennsylvania
The 60-day rainfall anomaly map covering March 13 through May 12 shows the deficit zone in deep red across a large swath of the Mid-Atlantic:
The numbers tell a painful story for communities south of the storm track. Washington DC is running 3 inches below normal over this 60-day period. Baltimore, Maryland sits at 3 to 4 inches below normal on the map with the BWI airport recording 5.98 inches below normal for the full period since January 1. Easton, Maryland and California, Maryland are both showing 4 inches below normal. Salisbury, Maryland on the Eastern Shore is also in the 4 inch deficit range. Dover, Delaware sits at approximately 4 inches below normal. Winchester, Virginia and Hagerstown, Maryland are running 2 to 3 inches below normal. Frederick, Maryland shows a 2 inch deficit while McHenry, Maryland in the western mountains is at 2 inches below. Charlottesville, Virginia and Richmond, Virginia are both deep in the red zone with deficits of 4 to 5 inches below normal over the same 60-day period.
The Surplus Zone: Pittsburgh and Points North
Cross the storm track line running through Pennsylvania and the picture reverses completely. Pittsburgh, Pennsylvania sits at 2 to 4 inches above normal over the same March 13 through May 12 period. Areas north of Pittsburgh are also showing surplus conditions in the green zone on the map.
This is not a small difference. The gap between Pittsburgh at plus 2 to 4 inches and Baltimore at minus 3 to 4 inches on the map represents a total moisture spread of 5 to 8 inches across communities that are only a few hours apart by car.
Why This Is Happening
The storm track explains everything. Over the past 60 days, the dominant storm systems tracking across the Mid-Atlantic have been running just north of a line slicing Pennsylvania roughly in half. Pittsburgh and communities to the north catch the heaviest rain from these systems. Harrisburg and Philadelphia sit in a transition zone running 1 to 3 inches below normal. Baltimore, Washington and Virginia communities fall south of the storm track where they receive only the dry back edge of these systems rather than the rainfall cores.
The result is a growing drought across Maryland and Virginia that has been building quietly since at least January 1 based on the BWI deficit of 5.98 inches.
What This Means Going Forward
Most of Maryland is running 2 to 4 inches below average for just this 60-day window alone. Combined with the 5.98 inch deficit at BWI going back to January 1, the region needs a sustained pattern change that brings multiple significant rain events directly over Maryland and Virginia rather than tracking north of Pennsylvania as storms have repeatedly done this spring. Until the storm track shifts southward, drought conditions across Maryland, Virginia and southern Pennsylvania are likely to persist or worsen.
WaldronNews.com will continue tracking the growing rainfall deficit and drought conditions across Maryland, Virginia and Pennsylvania including Baltimore, Washington, Frederick, Hagerstown and Richmond and will provide updates as the storm track pattern and rainfall anomalies develop through spring 2026.